Getting started
This is a quickstart guide that explains the essential things you need to know for your first research project in Condens.
/f/99166/1664x936/f340fa20aa/getting-started-thumbnail-s.png)
Inviting colleagues for collaboration
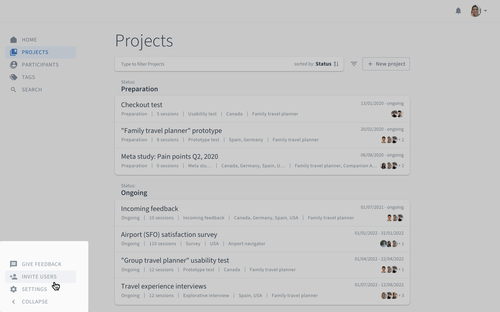
To collaborate with colleagues or clients on Condens invite them with the button on the lower left in the tool. Enter their email address and they will receive an invitation.
Starting a project
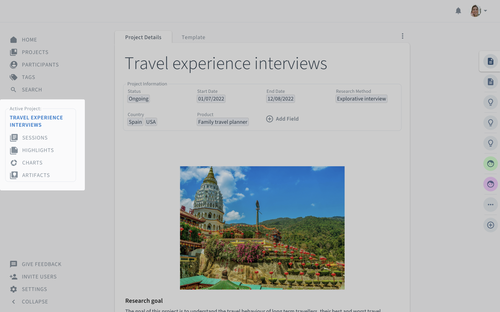
Select in the menu on the left and choose . A project consists of five parts:
The overview page is where you add a title, project information, and the description
is where you enter raw data and notes from your research activities
is where you analyze data and identify patterns
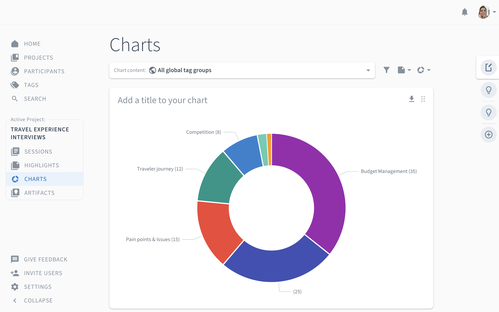
is where you can enrich your qualitative data by quantitative visualizations of your research data
is where you summarize findings before sharing them with others
You can also directly from a Folder in the page.
Tip: Organize your Projects into Folders for better structure and navigation. Folders let you group related Projects—such as by product, team, or business unit—helping you quickly locate information and maintain a clean workspace.

Entering research data
In Condens you enter research data and feedback in Sessions. If you conduct interviews, for example, each interview is one Session.
In a Session, you can enter notes yourself or paste from another tool. Condens is a collaborative tool, so you can take notes with others in real-time.
To upload files like audio and video recordings, images or PDFs just drop them to the respective Session or use integrations to import data. If you uploaded an audio or video file Condens can automatically generate a transcript from it.
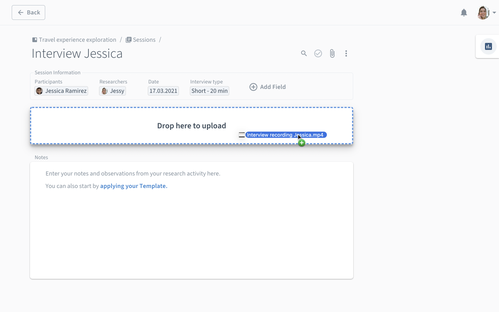
With Session Information you can store metadata about that Session like what type of interview it was or the URL to a prototype you are testing. Use the Participants information field to link a research participant to the Session. This lets you build a database of participants and analyze data based on user segments.
Structure data with tags
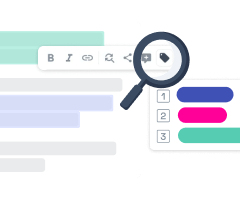
The first step is to categorize evidence using tags. Mark some text from the transcript or your notes and assign a tag to create a highlight. Highlights are pieces of evidence and the basis for analysis and sharing in Condens.
Analyze data
From any screen, you can click on the right to open the Note. This is the space where you start documenting your findings. You can start with a note and jot down ideas and cluster research highlights to discover patterns. Notes can follow a document style or be based on a whiteboard. From all notes, you can turn outcomes into findings, reports, or other shareables. You can freely switch between formats of your Artifact.
Pull highlights to the Artifact with drag and drop. Placing multiple highlights on top of each other will create a cluster - similar to affinity diagramming with post-its on a wall.
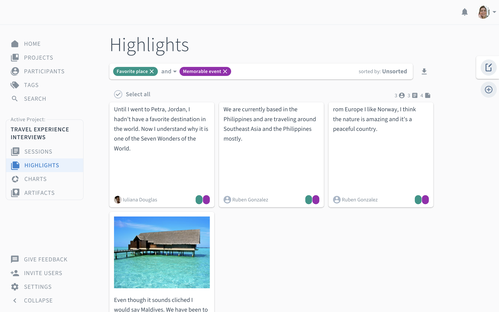
The screen shows all highlights across Sessions. Here is where you can analyze the data in a structured manner. Filter and sorting functionality helps to see patterns more clearly. Again, open the Artifact on the right to pull highlights into it and build clusters.
The help you quickly visualize your research data, look at your research data from new perspectives and enrich your qualitative data by quantitative visualizations. Again, open the Artifact on the right to pull charts into it.
Sharing findings
The final part of your project again shows the , but now in a full-screen mode. Here is where you add the final touch by providing more context to your findings, including images and formatting text.
Share an Artifact via link
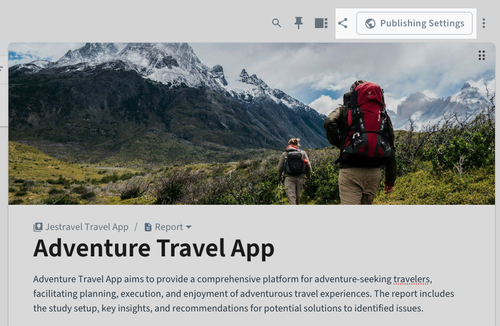
With you can create a shareable link to the Artifact for your audience and specify the access settings.
In the access settings, you can choose if you want to share the Artifact with:
People with access to the Project,
Any Stakeholder or Researcher with the link,
or Anyone with the link.
You can specify the security settings and require password to open the shared link.
Note: The required password is only available for the following access settings: Any Stakeholder or Researcher with the link; or Anyone with the link.
You can specify the privacy settings and choose if you want to display Participant names and applied Tags.

Check Access Summary for this Report below the settings to see if you’re sharing exactly what you want.
Sharing Highlights via link
If you want to keep your stakeholders engaged early on, you can share smaller pieces of evidence multiple times throughout your research process with .
Share Highlights from the transcript or from the Highlights overview.
In the access settings, you can choose if you want to share the Highlight with:
People with access to the Project,
Any Stakeholder or Researcher with the link,
or Anyone with the link.
You can specify the media settings and choose how to display your Highlight.
You can specify the security settings and require password to open the shared link.
Note: The required password is only available for the following access settings: Any Stakeholder or Researcher with the link; or Anyone with the link.
You can specify the privacy settings and choose if you want to display Participant names and applied Tags.
Copy the sharing link to share it with your stakeholders.
Publish an Artifact to the Insights Magazine
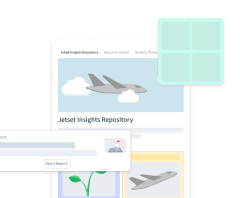
With you make the Artifact accessible to all Researchers and Stakeholders in the Insights Magazine, the dedicated stakeholder repository.
You can specify the privacy settings and choose if you want to display Participant names and applied Tags.
You can specify the notification settings and choose if you want to automatically share the Artifact in your Slack channel.
You can click to check how the published Artifact would look for your audience.

Check Access Summary for this Report below the settings to see if you’re sharing exactly what you want.
The published Artifact might contain all the data and evidence that you included but doesn’t allow you to jump back to the raw data (i.e. Sessions and Highlights) and is read-only.
If you are conducting multiple projects and want to centralize all your research data read our guide on setting up a UX Research repository in Condens.

