A digital whiteboard built for UX Research

Discover patterns in UX Research collaboratively on a digital whiteboard. Create engaging affinity diagrams, user journey maps, empathy maps and many other deliverables and share them with your stakeholders.
Icon of a postits

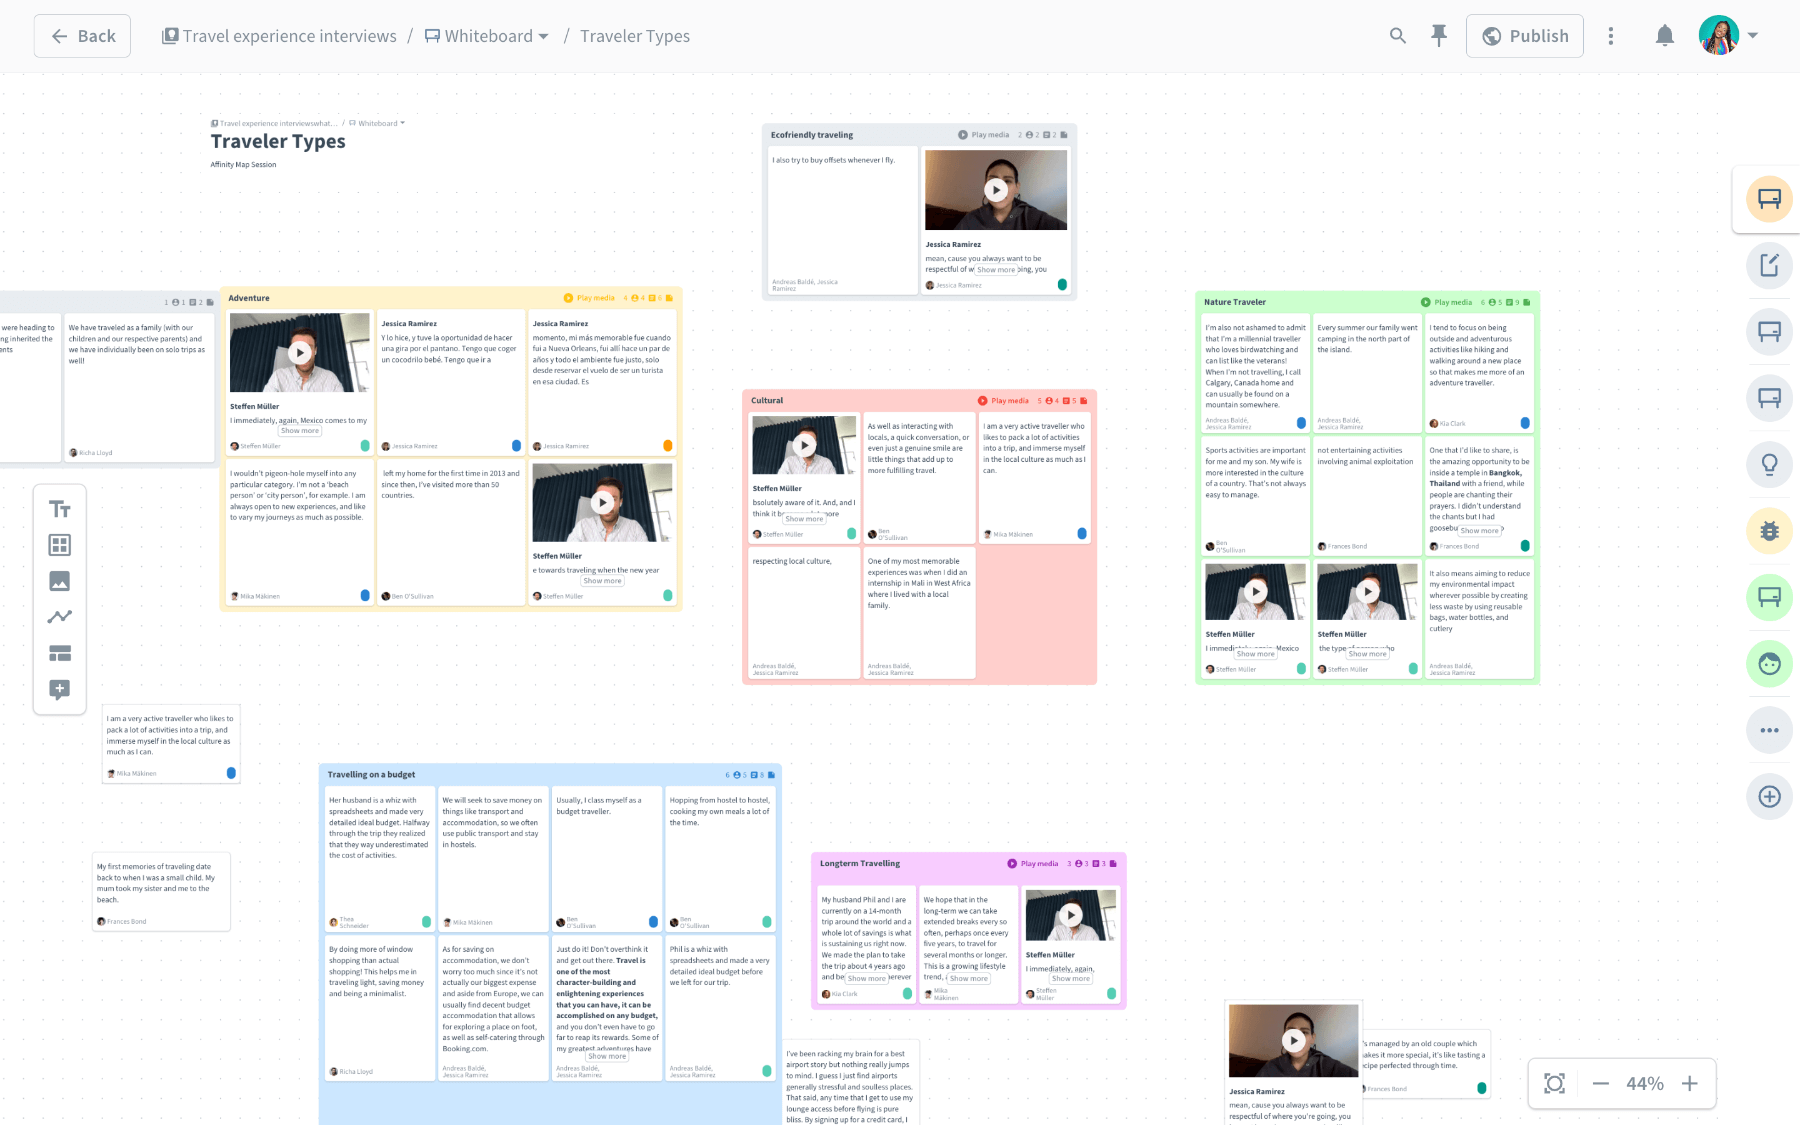
Free-form affinity mapping

Use highlights and findings from user research in affinity maps to learn from gathered unstructured data.
Icon of a connections

Spot high-level trends

Share a read-only version of your whiteboard with unlimited viewers with a simple link and get their feedback.
Icon of a share

Easy sharing

Share a read-only version of your whiteboard with unlimited viewers with a simple link and get their feedback.

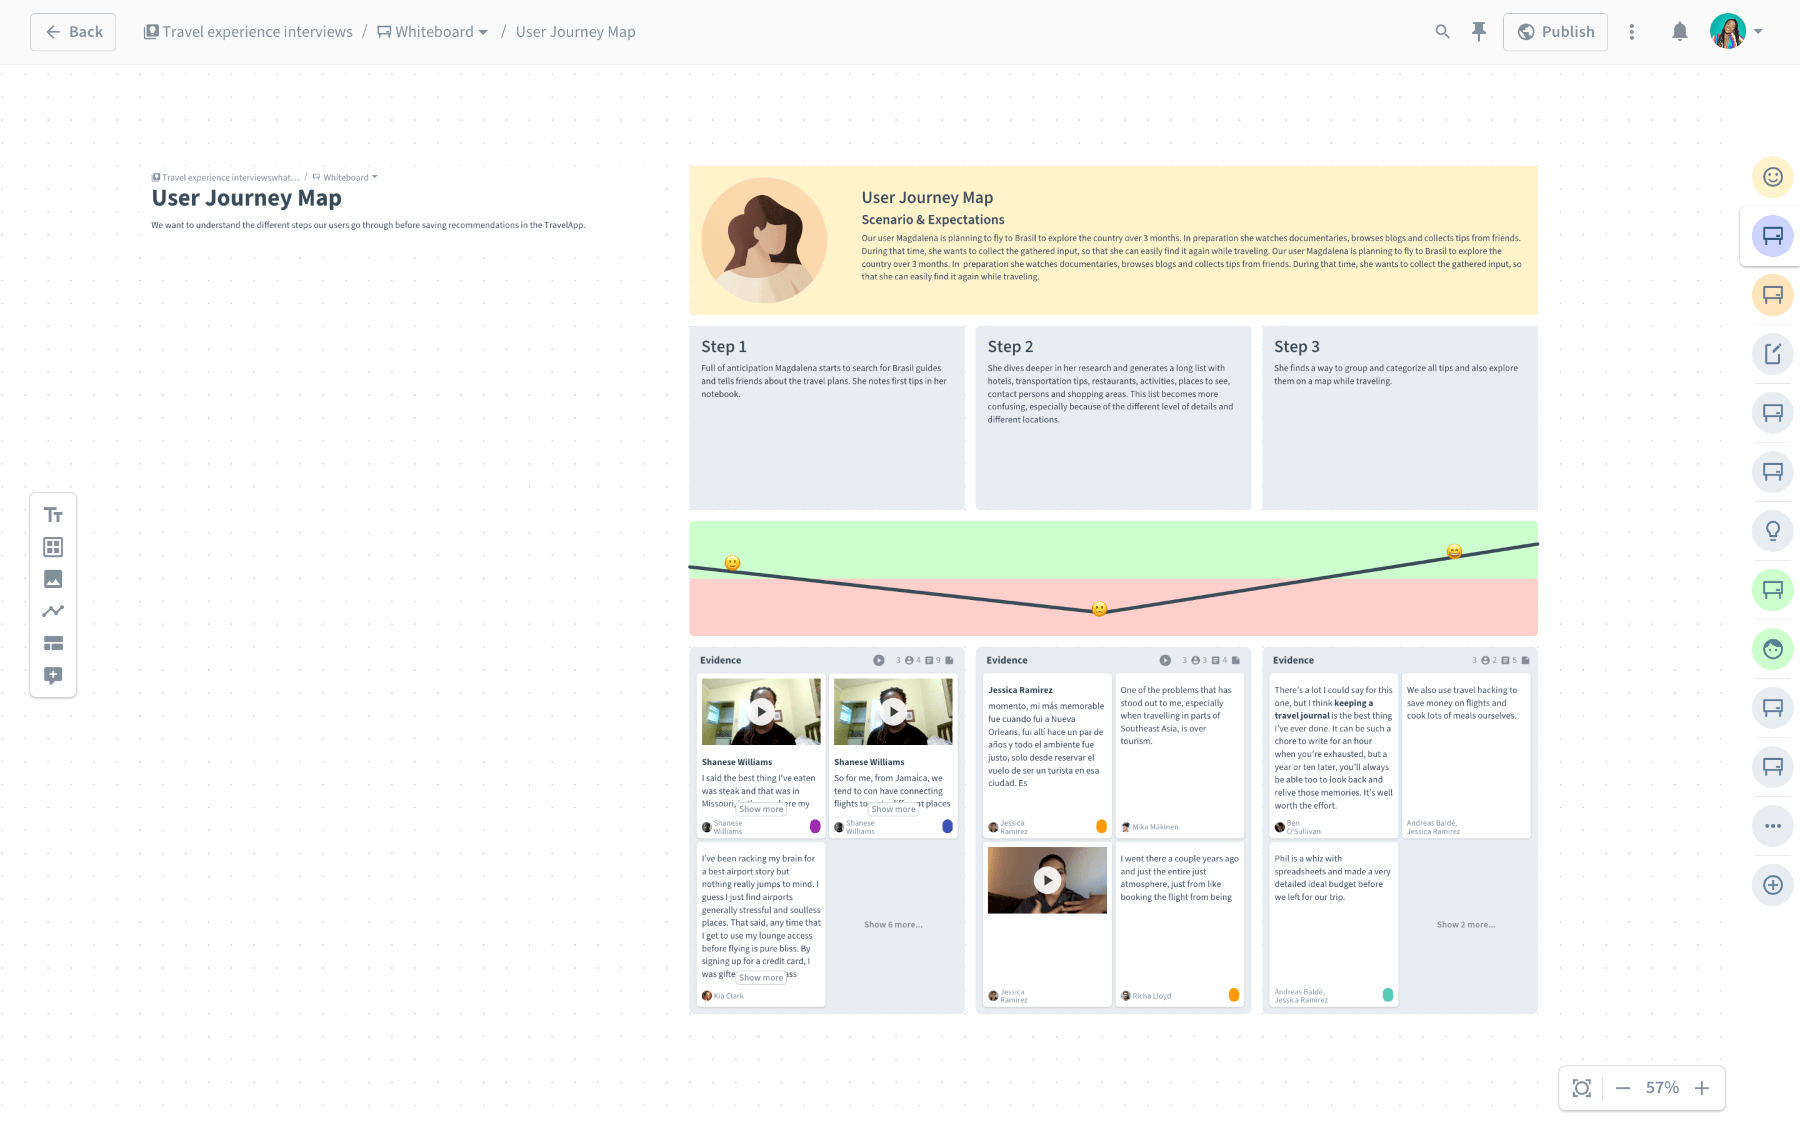
Use the infinite whiteboard to make sense of what you’ve gathered

Analyze collaboratively

Conduct collaborative analysis sessions with the team. Cluster highlights, artifacts, and more research data on the infinite whiteboard simultaneously.

Drag in what is relevant

Instead of going through a massive stack of research highlights, apply filters and make use of contextual information to find relevant data to include on the whiteboard.

User Journey Maps and more

Use the whiteboard to create evidence-based and well-structured user journey maps, empathy maps, and more.

Switch to the right level of details

Explore user quotes and replay video snippets to understand the gathered highlights. Zoom out to discover high-level patterns and learn how clusters relate.


"Affinity mapping is the essential tool that brings us from tagged evidence to findings."
Image of Mindy Harrell
Mindy Harrell
Senior UX Researcher at Hepsiburada

Create user research artifacts connected to raw data

Screenshot of an affinity map in Condens Screenshot of an user journey map in Condens Screenshot of an empathy map in Condens Screenshot of the templates section in Condens

Affinity Map

Uncover patterns by sorting and grouping snippets from UX Research on a digital whiteboard.

User Journey Map

Visualize and communicate the experience of your customers and users, backed up with user research evidence.

Empathy Map

Visualize attitudes and behaviors based on original user research data for a deeper understanding of users.

Create your templates

Visualize UX Research deliverables by applying various content elements from colored boxes and research clusters to images and descriptions.


Freeletics team photo

Online Affinity Mapping in UX Research: 9 Tips on how to come to actionable insights

Learn what Affinity Mapping is about and find practical tips with a particular focus on the virtual setting.
Read more

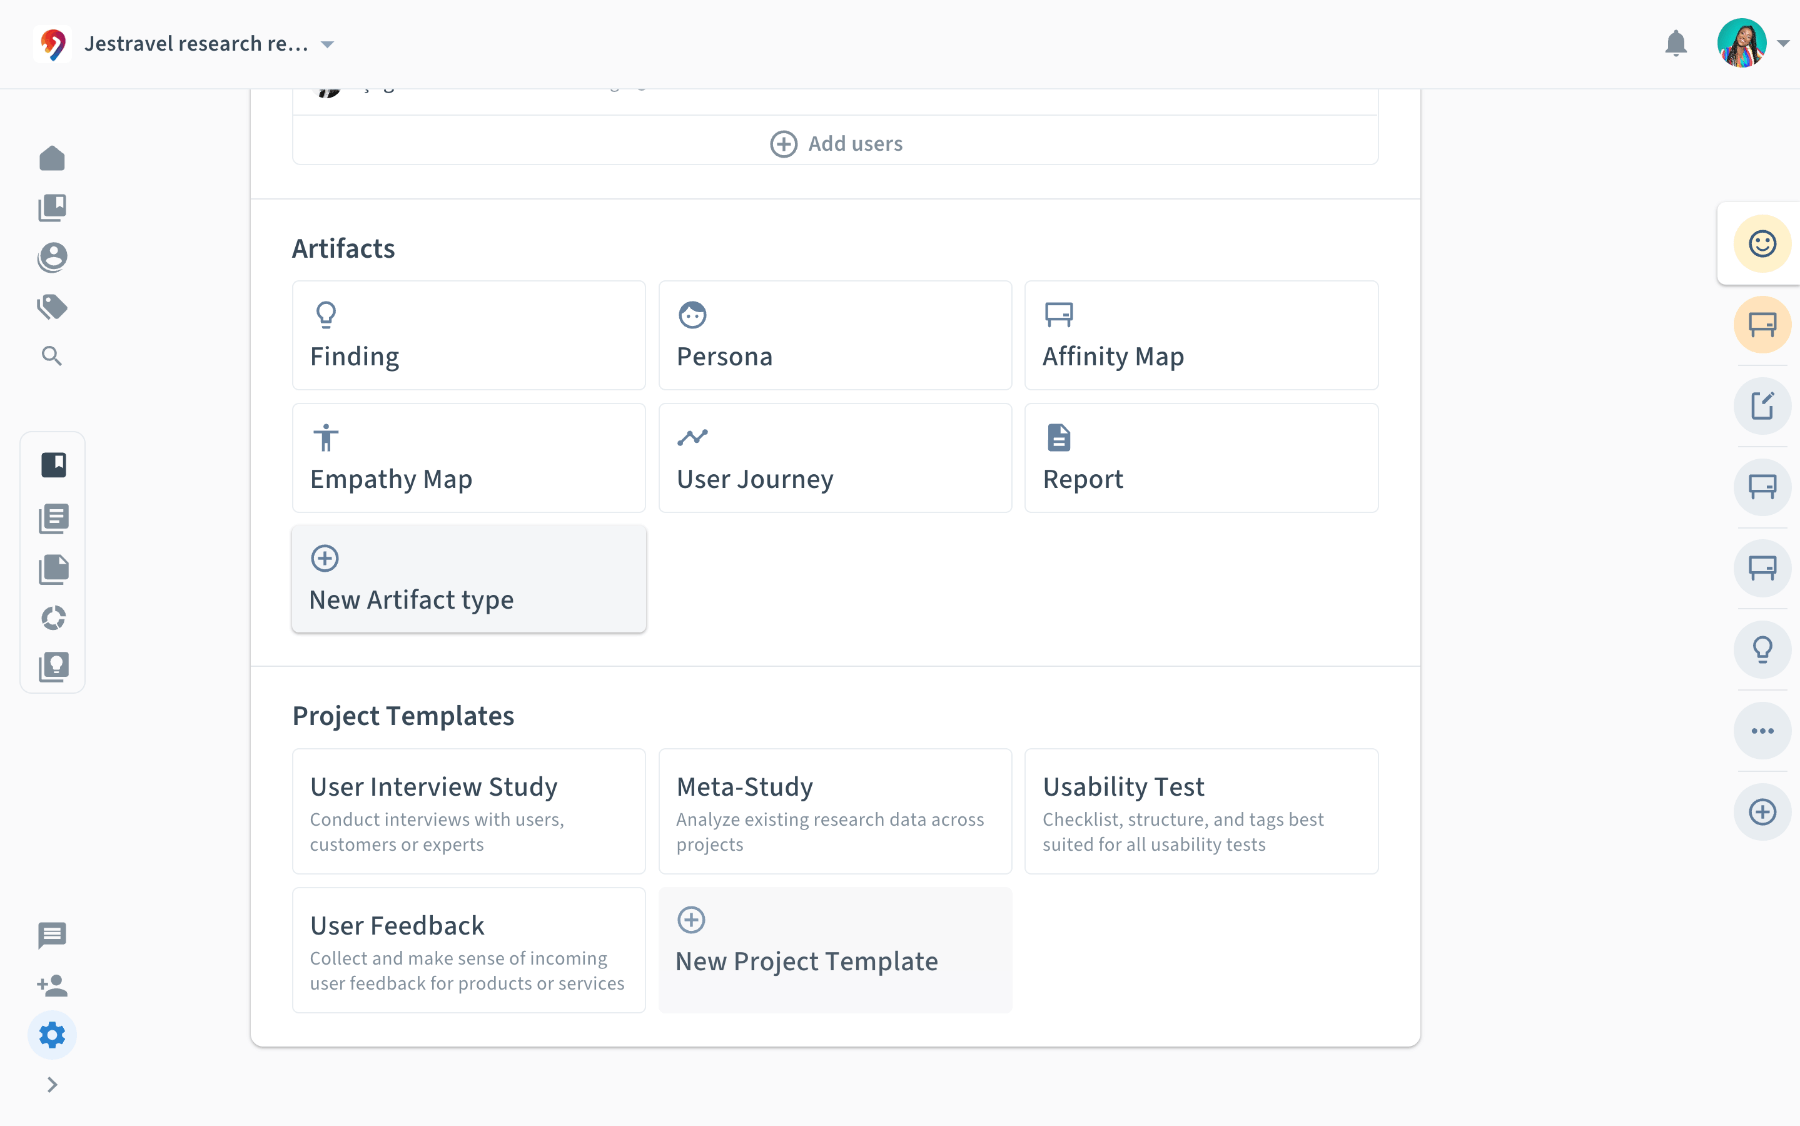
Curious to see how the Condens digital whiteboard can help you uncover patterns in your UX research data?