
How to Analyze User Interviews and Turn Raw Data into Insights
Analyzing user interviews is the most exciting, but also the most messy step when conducting user research. It’s exciting because it can reveal eye-opening insights that help to create game-changing products and services. At the same time, it’s messy because there is no standard procedure to follow, no objective measure of progress or success and the sheer amount of unstructured data can be paralyzing.
This article will show you how to get started and provide concrete tips on how to analyze user interviews to uncover valuable insights.
We start off by introducing the goals of interview analysis, defining what good results look like, and pinpointing the ideal timing for conducting this analysis. The core part is a step-by-step approach describing the process of how to analyze user interviews for the best outcomes. It ends with a list of common mistakes that you can learn from.
Note: The user interviews we – the founders of Condens – conducted as a basis for our user research tool will serve as an example throughout this article. These interviews were with UX researchers, so it’s going to be a bit meta, but also fun :-)
Purpose of analyzing user interviews
The question regarding the objective of analyzing user interviews might appear straightforward, but it's more nuanced than it seems. In fact, there are two distinct goals, both carrying significant importance. While one is readily apparent, the other is not as obvious.
Turn raw data into insights
The most common expectation associated with interview analysis is the conversion of raw data into valuable insights. Starting with a bunch of notes and recordings to extract valuable learnings. And indeed, transforming raw data into insights is a central objective of the analysis phase.
While analysis makes raw interview data more actionable, it is important to note that this step doesn't generate absolute truths. At best, it increases certainty about a hypothesis or approach.
Get buy-in from stakeholders
The second, less obvious objective during the analysis phase is to secure buy-in from stakeholders and rally them behind the findings. Valuable insights only make a difference if they become the foundation for decision-making. This requires that colleagues or clients truly understand, acknowledge, and retain these insights.
A proven way to achieve that is to let stakeholders actively participate in the analysis instead of merely presenting results to them. The activity of analyzing interviews as a group is just as important as the resulting insights.

At Condens, we made a deliberate choice to engage all three founders - representing UX, engineering, and business - in the analysis process full-time. Looking back, this decision proved invaluable in building trust in the findings and fostering a shared understanding within the team. This shared understanding became the bedrock for efficient decision-making in the later stages. Moreover, it had the additional benefit of bringing diverse backgrounds into play, resulting in a variety of perspectives and fresh insights. So whenever possible, consider inviting individuals such as designers, product managers, and engineers who have a stake in the project to participate in the analysis.
Defining qualities of a good insight
How do you know you have done a good job and the analysis was successful? While there is no objectively measurable way to determine a good insight, there are indicators that show the right direction.
1. Trustworthy - grounded in data
The process of interview analysis is the abstraction of raw observations into more general insights. For these to be reliable, it’s important that they are based on evidence from the interviews.
A common problem to watch out for here is cognitive bias (opens in new tab), e.g. the tendency to confirm what we already believe. These can distort the analysis process and misguide decisions. Read this article about common biases in user research and tips to avoid them.
While it’s important to ground insights in evidence, we shouldn’t forget the limitations of qualitative data. For instance, user interviews will not yield statistically significant results. Rather focus on the strengths of qualitative data in revealing causal relationships, emotional states of users and thus far unnoticed perspectives.
2. Relevant - fitting to the research goal
Interview analysis will likely take several hours over the span of multiple days. It’s easy to get distracted in details and lose sight of the bigger picture. This may result in spectacular findings that have nothing to do with the initial research questions (hint: still save those findings as they may become relevant in the future). To avoid unintended deviations continuously remind yourself of the main questions to be answered and make them visible regularly during the process.
3. Novel - uncovering what was hidden
To be clear: it’s totally fine if insights confirm previous beliefs. Analysis shouldn’t bend evidence just to produce new and exciting findings. At the same time, looking a bit deeper into the data instead of only scratching the surface can reveal unexpected connections or entirely new topics. These unexpected findings multiply the value of user interviews.
When to conduct user interview analysis
User interview analysis is a distinct step in the course of a research project. But that doesn’t mean analysis only happens during that designated time. The brain immediately starts to process new data by trying to make sense of it. Ideas can spark and patterns can emerge while you are still conducting interviews. Also, reviewing with the team after each interview is a great way to identify early ideas while the memory is fresh. Be sure to capture all these ideas as soon as they arise.
There are two possible approaches when to schedule the main analysis part within the course of the project.
Analysis in one go
In this approach, analysis begins after all interviews have been conducted. All the data is available from the start, which may make it easier to recognize patterns because there is more related evidence. A longer block of analysis facilitates getting into a state of flow as there are fewer interruptions. Of course, you need to be aware of fatigue and keep an eye on the team’s energy level.

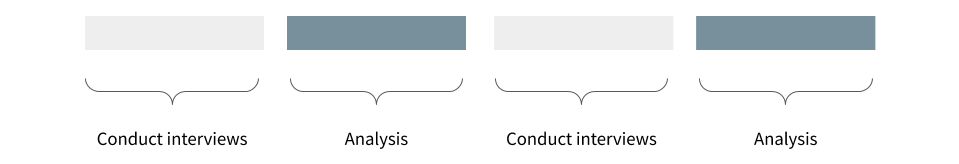
Batch-wise analysis
The idea of this approach is to divide the interviews into batches and to run shorter analysis sessions after each batch. One advantage is that you can still adjust the questions of upcoming interviews, for instance, to focus on an underrepresented topic. It can also be used to provide preliminary results to stakeholders or when there is not enough time for analysis after the last interview, e.g. due to a tight deadline. From a practical standpoint, it is easier to find several shorter blocks of time in the calendars of busy stakeholders than one large block.
A disadvantage of this approach is higher switching costs. It takes time to mentally prepare for the analysis, especially to get the evidence into short-term memory, which happens several times here.
A related question at this point is how much time to spend on analysis. You may have guessed that the answer is: it depends. There is a tendency to underestimate how long it will take and not allocate enough time. If you're faced with this decision, we'd recommend reducing the scope and focusing on the most important issues first, rather than rushing through it. On the other hand, you can always do more analysis, so be sure to timebox (opens in new tab) the sessions.
As a reference, we spent a full week to analyze the 18 hours of interview data we collected for Condens.
Step-by-step approach to user interview analysis
Now let's start digging into the data. The basis for successful analysis – or synthesis as it is also referred to – is good note taking(opens in new tab) and we assume you have documented all interviews amply and consistently. When working collaboratively with stakeholders, block sufficient time in their calendars and inform them up front about what to expect.
We will tackle the analysis in three steps:
- Familiarize with the data
- Synthesize
- Convert findings into output
Step 1: Familiarize with the data
The goal of this first step is to prepare the brain to forge connections by getting the data into the short term memory. It’s like loading information into a computer to be able to work with it. In practical terms, this usually means reading the interview notes carefully. This is easier if team members were involved in the interview phase, for example as note takers.
To turn this familiarization step into a group activity, assign each stakeholder to a participant, let them read through the respective notes, and present themselves from their assigned participant’s perspective to the team. Then take some time to discuss each participant with the group. Since there are usually more interviewees than team members, you can repeat this multiple times.
Step 2: Synthesize
This part doesn’t follow a very strict process. Here we’ll show you four techniques which can serve as starting points. Use them flexibly and adapt them to your needs if necessary.
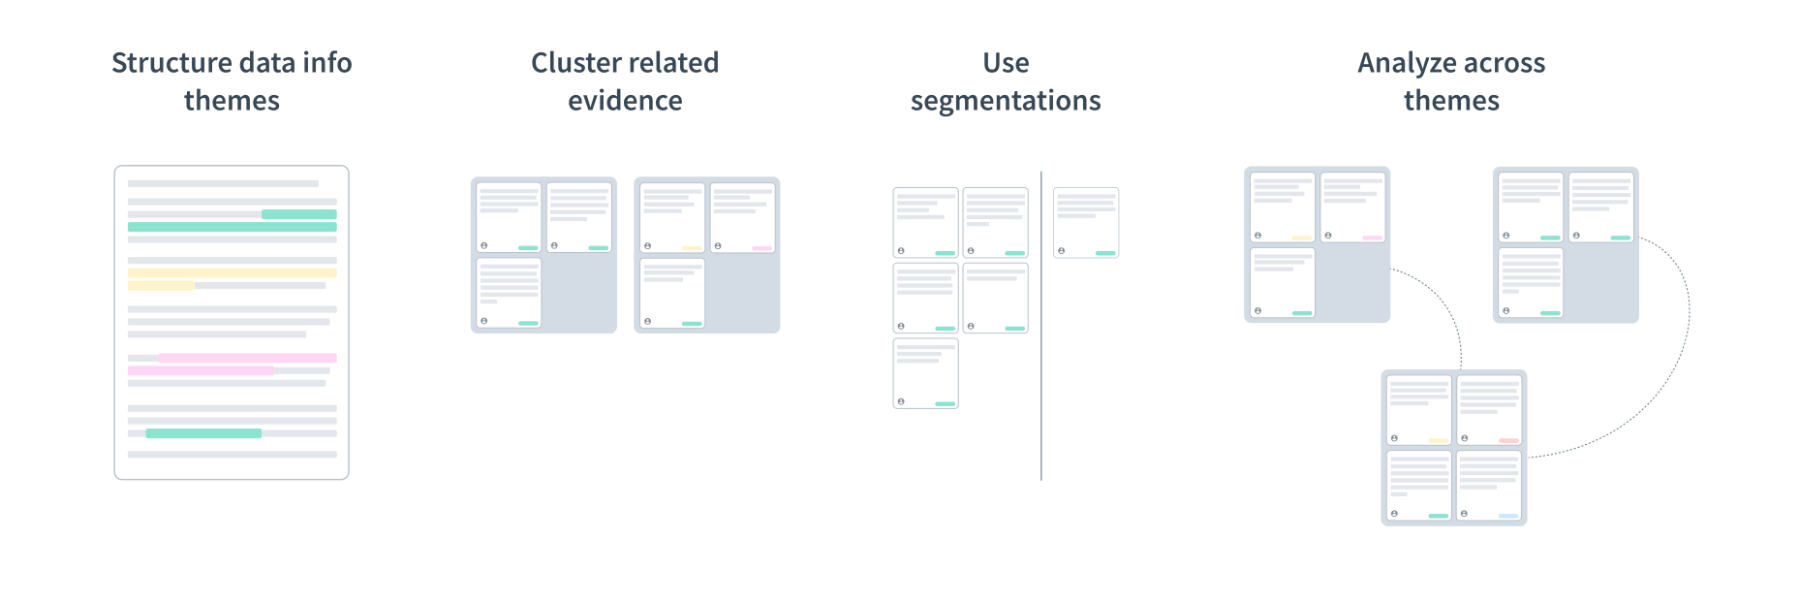
Structure data into themes
Because qualitative data is inherently unstructured and thus difficult to analyze, the initial task is to make it comparable across participants. We do this by assigning individual responses to more general themes.
The topics that you asked about during the interviews are good starting points for these themes. For instance, when we interviewed UX researchers before starting to work on Condens, we addressed topics such as participant recruiting, data privacy, and sharing research findings.
When working with digital tools, a practical way to assign notes to themes is to use tags. A tag is a label that indicates which topic a note belongs to. Regular text editing software doesn’t allow for this kind of tagging easily, so it’s better to use a spreadsheet or a dedicated user research tool, like Condens(opens in new tab).
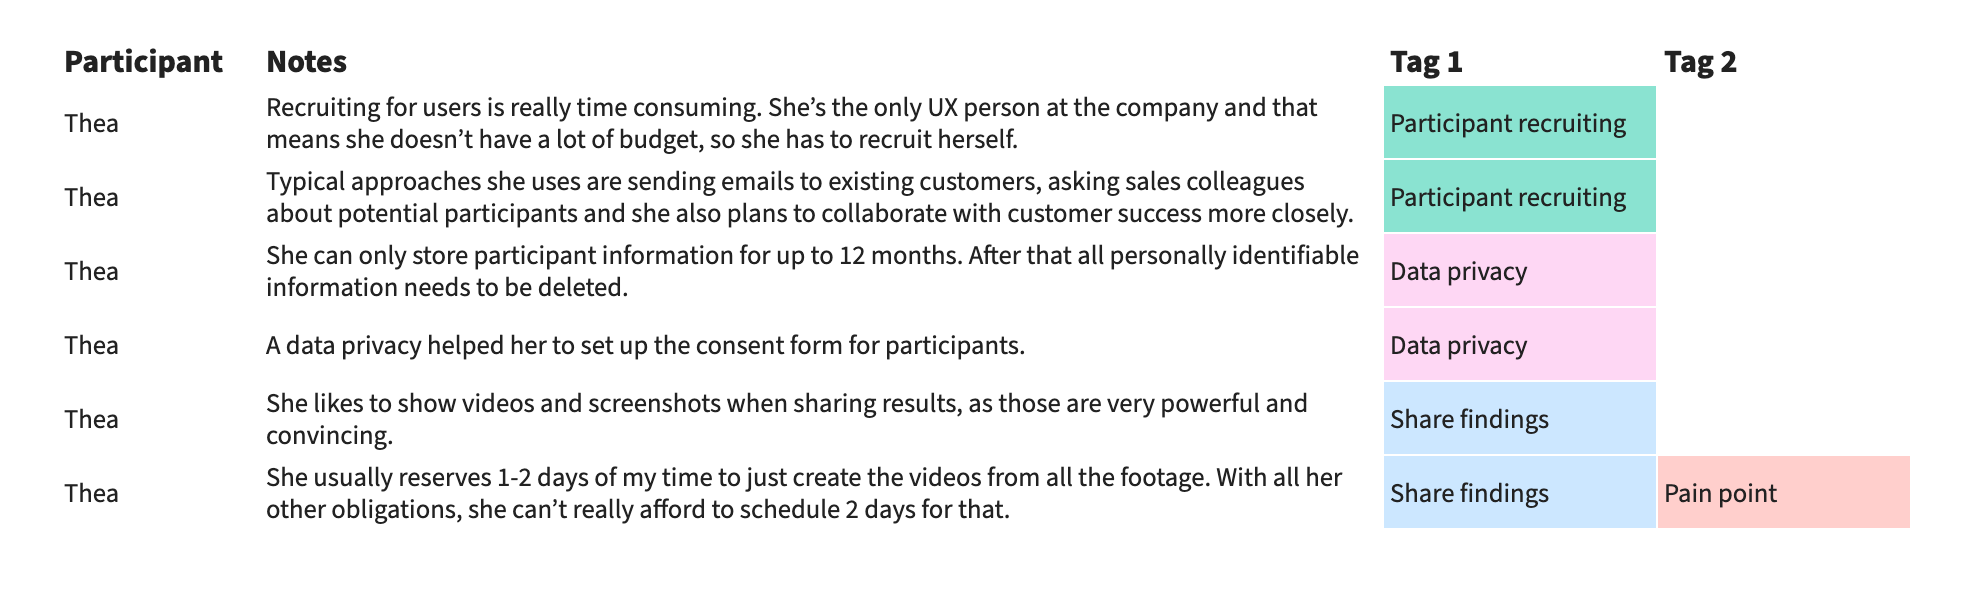
In the screenshot above you can see interview notes in a spreadsheet. Each note has its own row and the columns on the right show the respective tags.
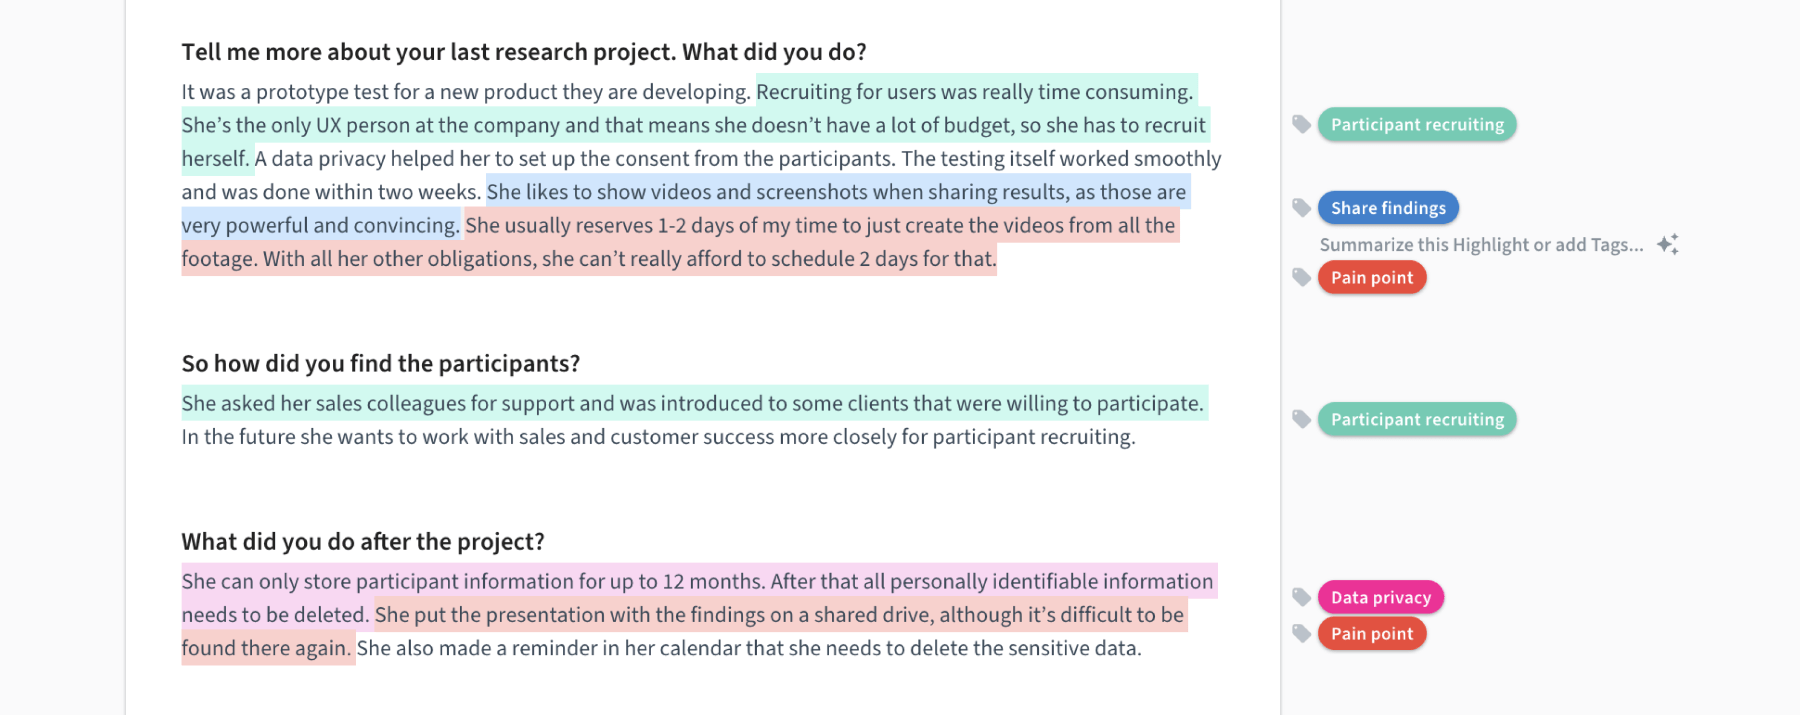
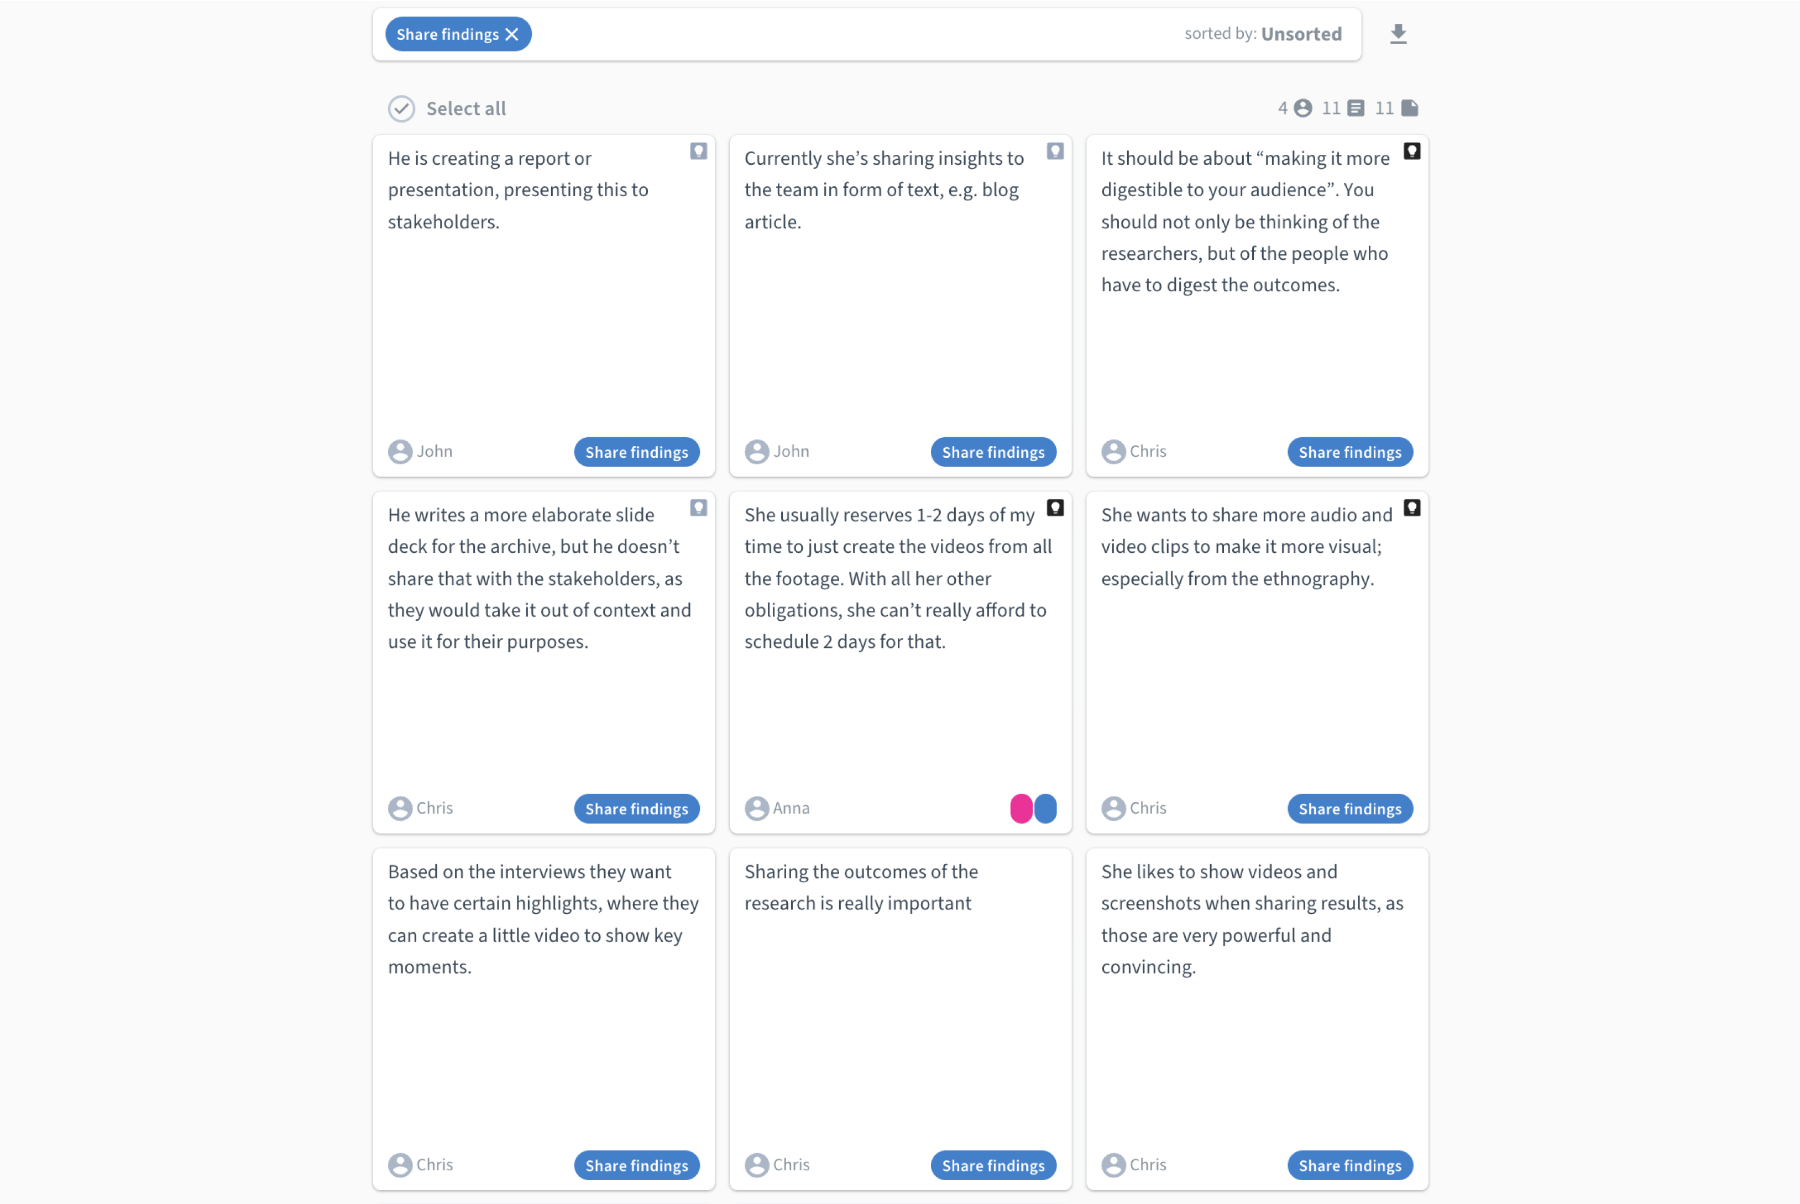
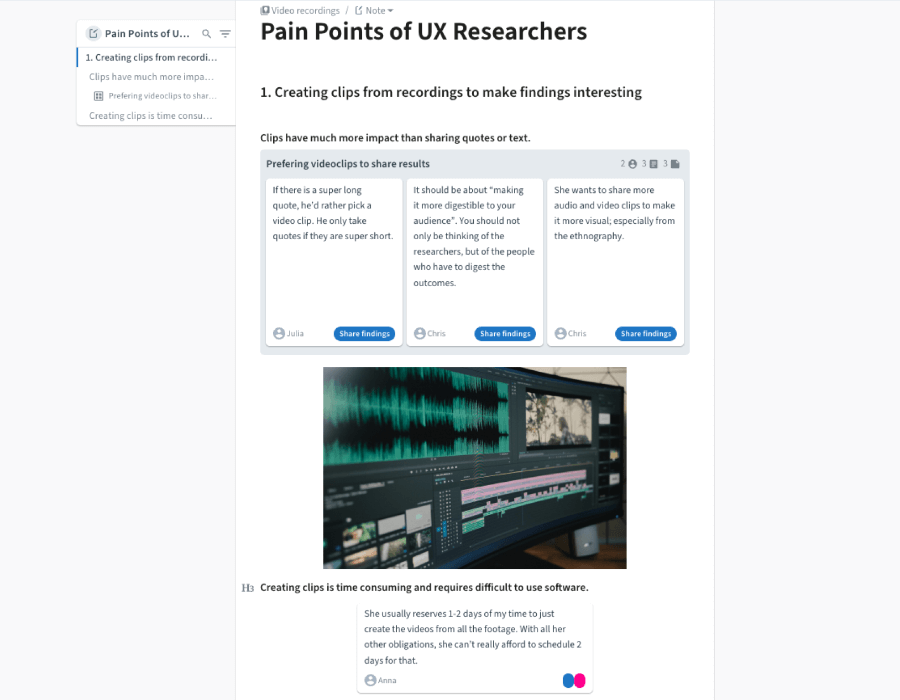
In a dedicated user research tool like Condens(opens in new tab), you have a text document format for notes and can assign multiple tags directly to the relevant words and sentences.
A common question is whether to come up with the tag names before starting with the tagging or create them on the go. The short answer: both are possible. Usually, you need to iterate over these tags while working through the data as new themes come up or two themes merge into one.
A tip for collaborative synthesis in a digital tool: book a meeting room and use a large screen to do the tagging and further steps of the analysis together. This is an approach that Freeletics likes to use to facilitate collaboration in user research(opens in new tab). This also works well remotely during a video call.

After you have tagged the first few interviews together as a team and built a common understanding, you may want to split up and do the remaining tagging in smaller groups or individually to progress more quickly.
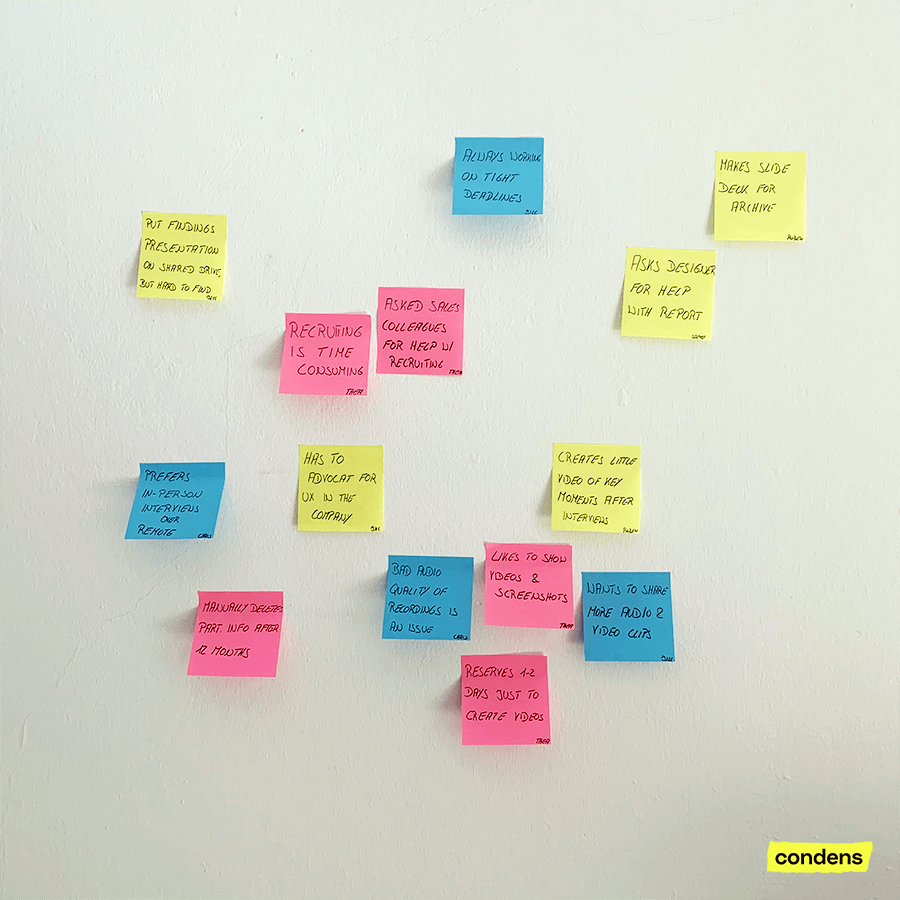
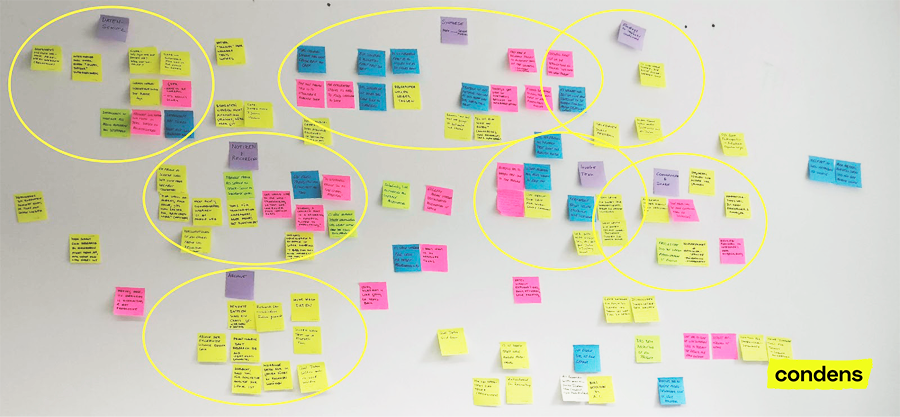
The analogous alternative to tagging data is to use post-its. For that, write one response per post-it and place similar responses closely together on the wall. Make sure to note the participant’s name or a short sign to provide a link to the raw data and context. Colors are great for segmentation, e.g. to indicate a certain user group. In the image below, we used yellow for in-house researchers, pink for freelancers, and blue for researchers in agencies.
Look for cross-participant connections and cluster related evidence
With the notes organized into themes, you can now dig into each of these themes separately. In a digital tool, use filters to focus on one tag in particular and look for commonalities or contradictions among the responses.
Encourage team members to share their thoughts with the group as this helps to form new concepts and understandings.
Next, you can group related observations into clusters. This method is also called affinity mapping or affinity diagramming and enables you to connect pieces of evidence to build up a broader understanding. For instance, we identified the sharing of video clips to be a recurring pattern within the theme of sharing research findings.
When working with post-its, just rearrange them to fit your observed clusters.
Admittedly, affinity diagramming is a bit difficult in a spreadsheet. One way to do it is to put the cluster a note belongs to in an additional column next to the tags, but it’s not really an elegant solution.
Depending on the amount of data it can take one hour or more to work through each topic. Pay attention to newly emerging themes and be prepared to split up or unify existing ones. Remember that it’s not a rigid process and you may need to start over with a newly discovered theme. That’s how you iterate your way towards the insights.
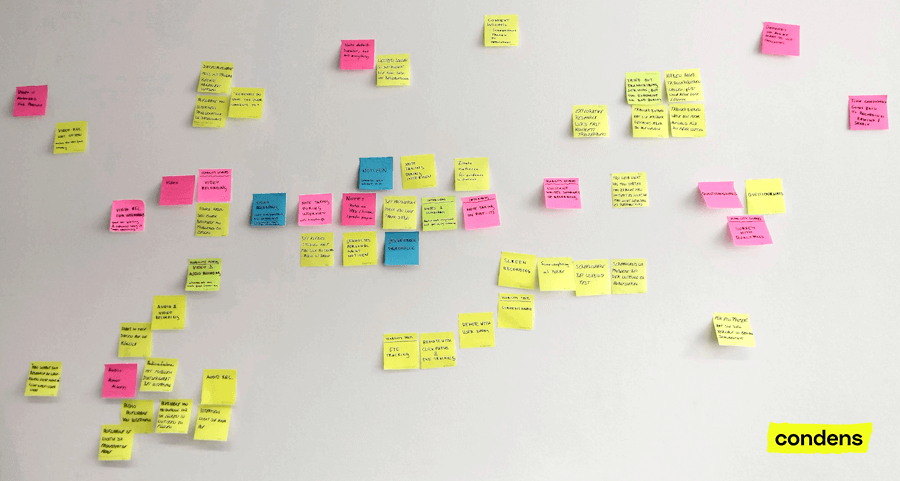
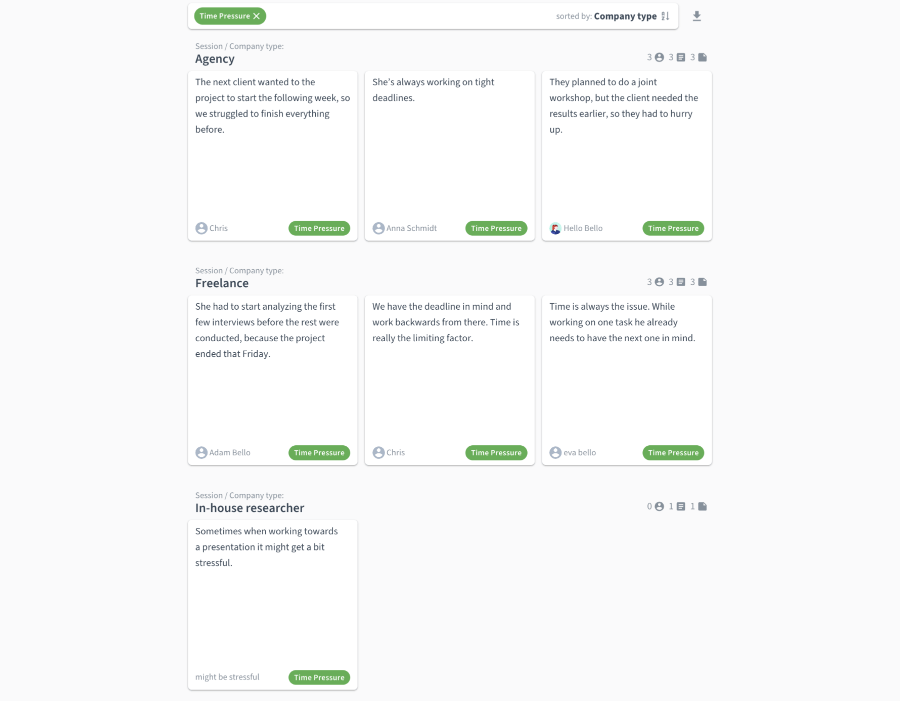
Use segmentation to reveal underlying patterns
It helps to look at the research data from different perspectives to get a deeper understanding of a topic. It’s like applying different lenses that help to see connections more clearly. Depending from where you look, the world can seem very different.
The metadata about the participants can be a key to discovering hidden patterns. In a B2B context, that might be the participants’ job titles, the size of the company they work for, or the industry. In a consumer context, demographics or level of experience with a particular product might be relevant criteria.
At Condens, after our interviews with UX researchers, we recognized that some participants complained about the time pressure to deliver research results, while others didn’t mention this issue. We dug a little deeper and found that this pain point was mostly coming from freelancers and researchers in agencies. In-house researchers didn’t complain much about tight deadlines. In hindsight, this makes sense, as external researchers are working on a contractually defined project and the next client may already be waiting.
Of course, not all phenomena can be explained with the available data, and it takes critical thinking and possibly some more research to avoid presuming causal relationships that aren’t there.
Analyze across themes
In addition to changing the perspective, changing the resolution is another method to get a clearer understanding of the data. Having identified themes and delved deeply into each of them in the previous steps, we now zoom out and look at the bigger picture.
Identify how the themes relate to each other and try to understand their relative importance, chronological order or causal relationships. We used a purple post-it to indicate a theme and put the respective name on it.
Step 3: Convert findings into output
With the extensive analysis phase complete, there comes a point where you ask yourself what to do with all these insights. The final step is to turn what you have learned into a tangible output.
There are two purposes for this:
- It makes it easier to communicate the insights to stakeholders who were not directly involved in the project, and it also helps them to retain what you found. Think of the output as a tool for sharing your findings.
- It initiates the transition to putting the insights into action, helping to move from learning mode to doing mode.
The best form of output depends on your initial research questions. Examples for commonly used outputs are:
- A prioritized list of pain points and opportunity areas
- A user journey including highlights and lowlights
- Jobs to be done
- User personas
Before the team parts, be sure to plan concrete next steps to put the findings into action. This could be a decision workshop, a prototyping session, or a design sprint. Also, think about how you want to store your data and findings so that they are accessible in the future. It should be easy for stakeholders to go back and look up specific aspects of the research at any time.
Common mistakes in analyzing user interviews
The best way to improve your user interview analysis skills is to practice and to learn from your experience. Here are some mistakes others already did to help you improve even faster:
Quantifying data
Be careful with formulating quantitative statements based on qualitative data, for instance: “75% of the participants mentioned data security to be a problem.” Especially the use of percentage values easily leads to wrong generalizations about market sizes.
User interviews aren't designed to yield statistically relevant results. At best you can formulate hypotheses about the general market that can be validated using quantitative data.
If you decide to use figures, stick to the “6 out of 8” format to remind your audience that the overall numbers are low. In general, using numbers is not bad because it helps to spot outliers, such as an opinion held by only one respondent.
Expecting perfect clarity
Qualitative data is messy and it will still be (although hopefully a lot less) after the analysis. Remember the goal is to reduce uncertainty, you won’t get perfectly clear answers. You want just enough certainty to make a decision about the next steps.
In fact, if there is very little uncertainty left you have probably overanalyzed and it would have been more effective to move on and try things out.
Do you have additional tips for interview analysis that we should include in this article? Or have you tried the techniques above and want to share your feedback? Write us at hello@condens.io. We look forward to hear from you.
