Analysis
From raw data to insights — spot patterns, connect dots, and uncover what matters.
Condens is made for user research analysis: Besides analyzing qualitative research data from user interviews, user feedback, or usability tests, you can include survey data in Condens and combine qualitative and quantitative research data. Easily bulk-import data from surveys, create highlights, and make sense of survey responses with Condens.
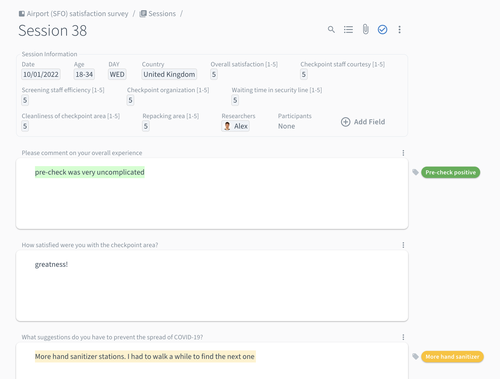
Survey data is best represented in Condens by using one session per respondent. Within a session, you can use sections to separate the questions. You can use the section description for the question asked to the participant and then the content of the section for the participant’s answer. You can then tag the content as usual.
When you have structured research data from a survey or structured interview already available, besides manually entering research data into Sessions, you can bulk-import this data and create multiple Sessions at once. In this step-by-step guide, you find detailed information on bulk-import for CSV, Excel, or Google Sheets files.
Condens provides a Zapier integration that enables you to set up automation between Condens and other tools. If your using a survey tool like Typeform, SurveyMonkey, or Qualtrics for example, you can connect them with Condens. This way you can send data from your survey tool to Condens automatically based on certain events (also called triggers).
Here's how you can connect the tools:
Connect both tools to your Zapier account with this step-to-step Zapier set-up guide.
Start creating your own Zap (your tool automation) on Zapier. You can use one of our templates for Typeform, SurveyMonkey, or Qualtrics as well.
Please note that this requires a Zapier account and may require a paid plan for Zapier.
Surveys often include various questions, like open-end, multiple-choice, or rating questions. For each question type, you can define the right way to bring the data to Condens. This works by assigning the appropriate field type in Condens for each survey question.
The following options are available for importing your survey data:
![]() Section
Section
![]() Number
Number
![]() Date
Date
![]() Checkbox
Checkbox
![]() Single select
Single select
![]() Multi select
Multi select
![]() Email
Email
![]() URL
URL
![]() NPS
NPS
For common survey questions, we suggest the following field types in Condens:
Free text questions are best imported to Sections. The answers will be placed in separate note sections of a research session. If you've collected other information, like age or email addresses with free-text questions, you could use Number or Email instead.
Multiple-choice questions (with single answers) are best imported as Multi select (or Numbers for numeric choices).
Multiple-choice questions (with multiple answers) are best imported as Single select (or Numbers for numeric choices). Select how the different values are separated in your file. You can choose between Comma, Semicolon, Slash, Tab, No Separation or define a custom separator.
Selection (drop-down) list questions are best imported as Single select (or Numbers for numeric choices).
Rank questions (and scale questions) are best imported as Single select or Numbers for numeric scales or NPS if appropriate.
Date/Time questions are best imported as Dates.
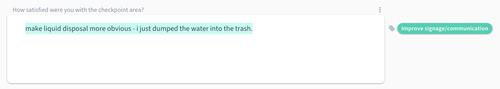
Preparation: In Condens, tags help you structure research data and prepare it for further analysis. Go through the Sessions and tag interesting answers in the note sections, where you can see all free-text answers for open-ended survey questions.
Tip: Quickly switch to the next or previous session by clicking 'Next/Previous Session' in the overflow-menu ![]() or using the respective shortcut:
or using the respective shortcut:
Go to next Session: ![]() +
+![]() +
+![]()
Go to previous Session: ![]() +
+![]() +
+![]()
Analysis: When you start to make sense of your raw data, you can look at your research data in a more structured way in ![]() Highlights and
Highlights and ![]() Charts.
Charts.
Basic workflow: Whenever something interesting comes up or when you discover a pattern, you can open the Artifact on the right and note down your findings. You can quickly bring highlights and charts to an Artifact with drag and drop. When you put highlights on top of each other, you can create clusters and conduct affinity mapping from any screen.
Analysis with ![]() Highlights: Here, you see all highlights that you created in the research project. In Highlights, you can then filter and sort by section title to see answers for a question across respondents.
Highlights: Here, you see all highlights that you created in the research project. In Highlights, you can then filter and sort by section title to see answers for a question across respondents.
Here, you can learn more about highlights in Condens.
Analysis with ![]() Charts: Here, you can create charts to display research findings more visually or look at your research data from other perspectives. For example, you can show the number of created highlights for all tags from a specific tag group.
Charts: Here, you can create charts to display research findings more visually or look at your research data from other perspectives. For example, you can show the number of created highlights for all tags from a specific tag group.
Here, you can learn more about charts in Condens.